13 Reproducible Survey Workflows
13.1 Reproducible Survey Workflows
13.1.1 Learning Objectives
- Overview of survey instruments
- Overview of data integration packages
- Practice in google forms integration through R
13.1.2 Survey instruments and methods
Surveys and questionnaires are commonly used research methods within social science and other fields. For example, understanding regional and national population demographics, income, and education as part of the National Census activity, assessing audience perspectives on specific topics of research interest (e.g. the work by Tenopir and colleagues on Data Sharing by Scientists), evaluation of learning deliverables and outcomes, and consumer feedback on new and upcoming products. These are distinct from the use of the term survey within natural sciences, which might include geographical surveys (“the making of measurement in the field from which maps are drawn”), ecological surveys (“the process whereby a proposed development site is assess to establish any environmental impact the development may have”) or biodiversity surveys (“provide detailed information about biodiversity and community structure”) among others. In social science, a survey can be defined as:
a research method involving the use of standardised questionnaires or interviews to collect data about people and their preferences, thoughts, and behaviours in a systematic manner. - Social Science Research: Principles, Methods and Practices
There are a large number of platforms that provide opportunity for structured feedback and have specific use cases, outside of formalized research methods. For example, participant registration (e.g. Google forms, Aventri), presentation feedback (e.g. Mentimeter), scheduling (e.g. Doodle). In this section we will focus on software designed or commonly used for research activity.
But first …
Discuss
Whether experienced in survey methodologies, or via knowledge of surveys from a user perspective, discuss the following questions:
- What survey software do you / have you used?
- What features or functionality did you like about the software?
- What features or functionality are important to you when considering survey software?
Identify an individual to summarize and report back to the full group.
13.1.3 Survey Needs and Software Solutions
Survey needs will vary across individual according to the nature of the research being undertaken. However, there is fundamental functionality that survey software should provide including:
- The ability to create and customize questions
- The ability to include different types of questions
- The ability to distribute the survey and manage response collection
- The ability to collect, summarize, and (securely) store response data
More advanced features can include:
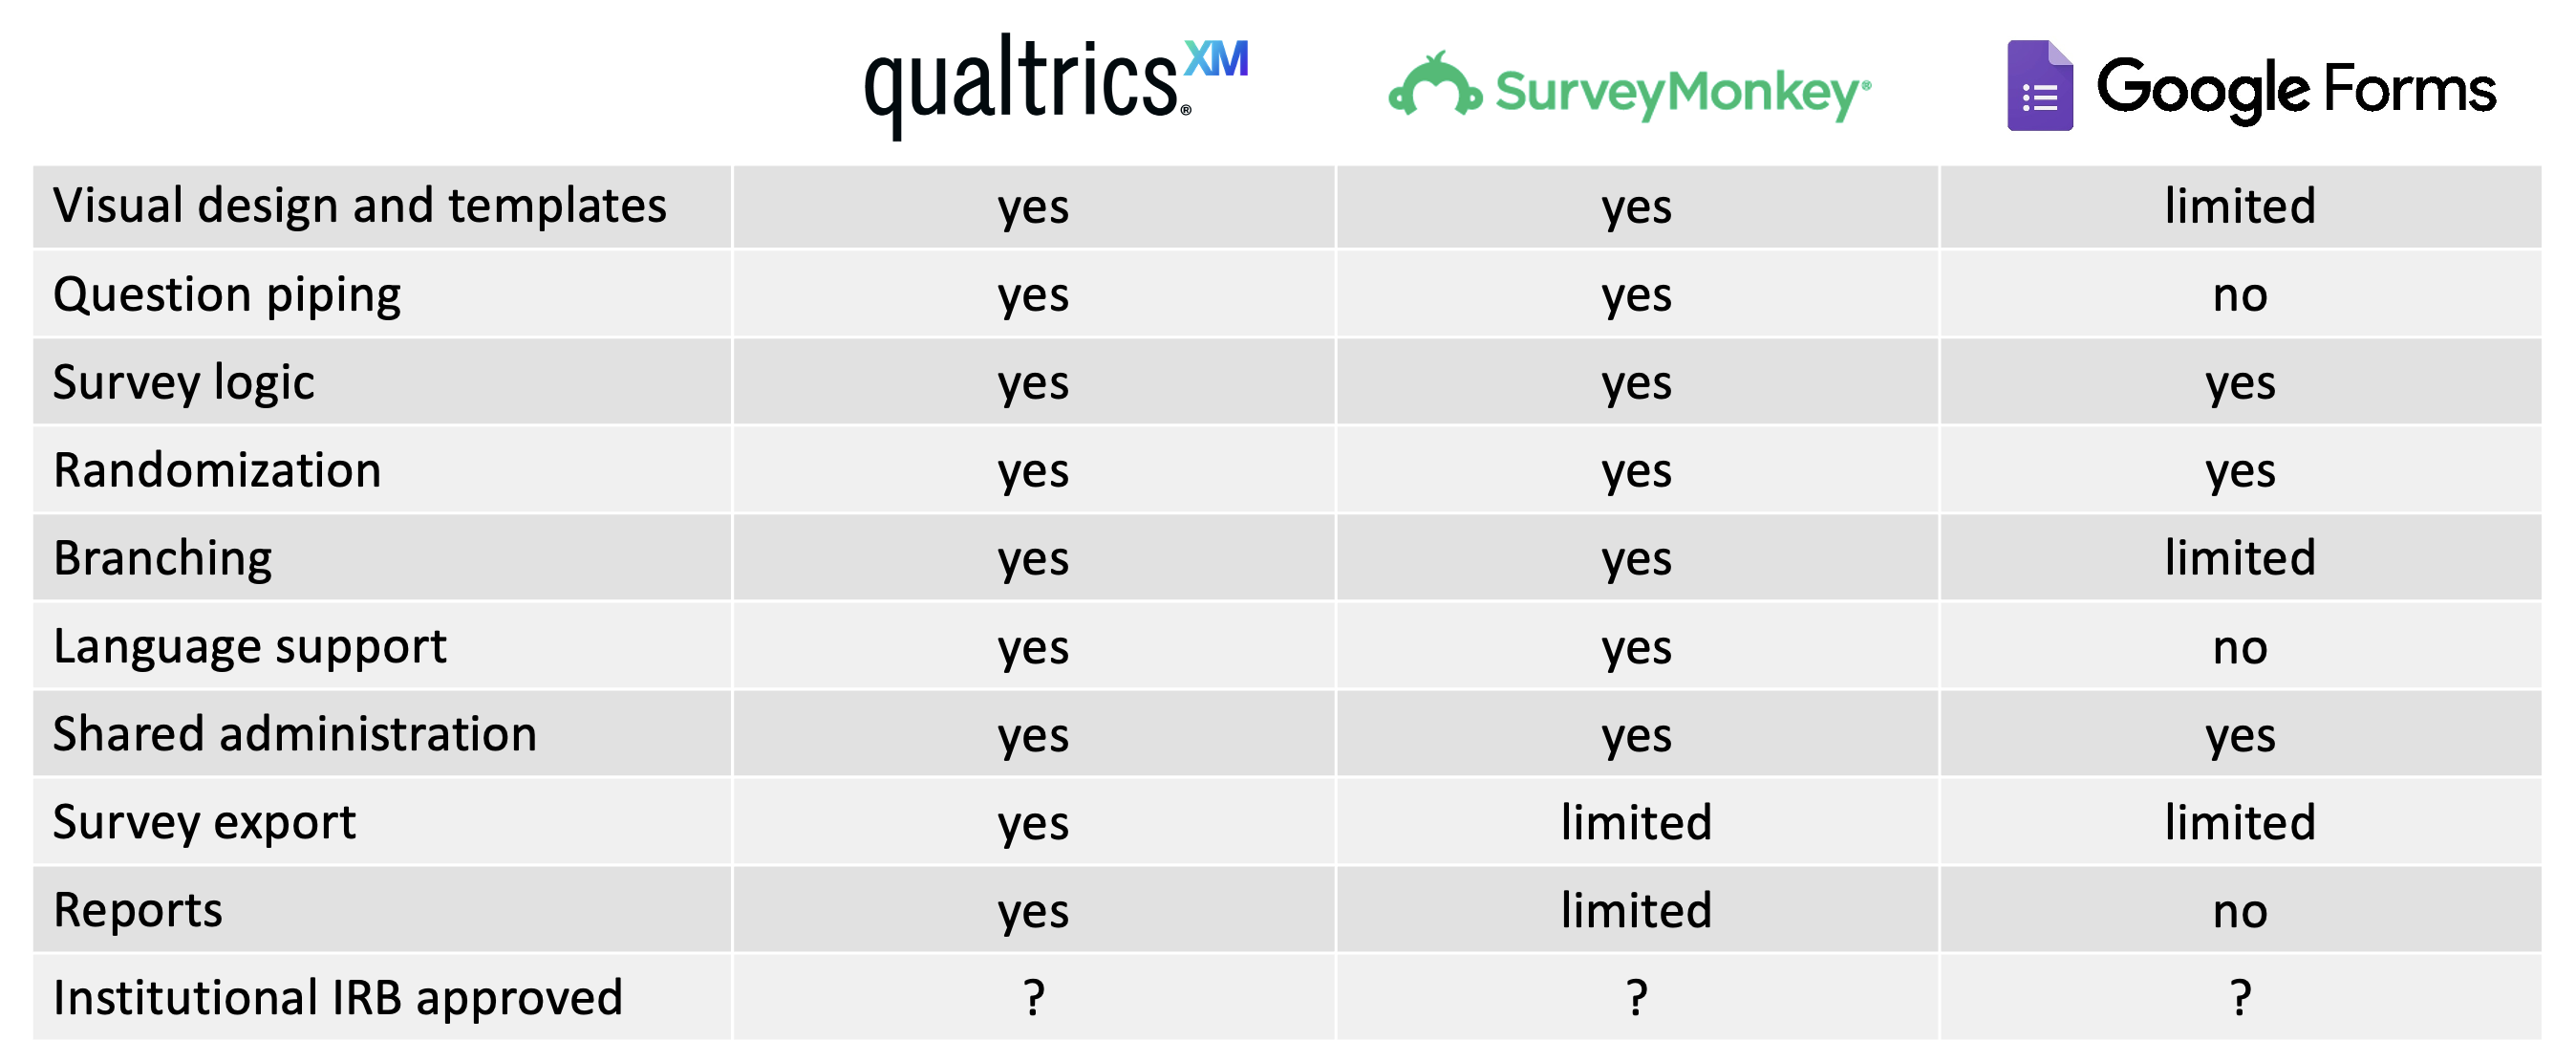
- Visual design and templates - custom design might include institutional branding or aesthetic elements. Templates allow you to save these designs and apply to other surveys
- Question piping - piping inserts answers from previous questions into upcoming questions and can personalize the survey experience for users
- Survey logic - with question logic and skip logic you can control the inclusion / exclusion of questions based on previous responses
- Randomization - the ability to randomize the presentation of questions within (blocks of) the survey
- Branching - this allows for different users to take different paths through the survey. Similar to question logic but at a bigger scale
- Language support - automated translation or multi-language presentation support
- Shared administration - enables collaboration on the survey and response analysis
- Survey export - ability to download (export) the survey instrument
- Reports - survey response visualization and reporting tools
- Institutional IRB approved - institutional IRB policy may require certain software be used for research purposes
Commonly used survey software within academic (vs market) research include Qualtrics, Survey Monkey and Google Forms. Both qualtrics and survey monkey are licensed (with limited functionality available at no cost) and google forms is free.
13.1.3.1 Data Validation
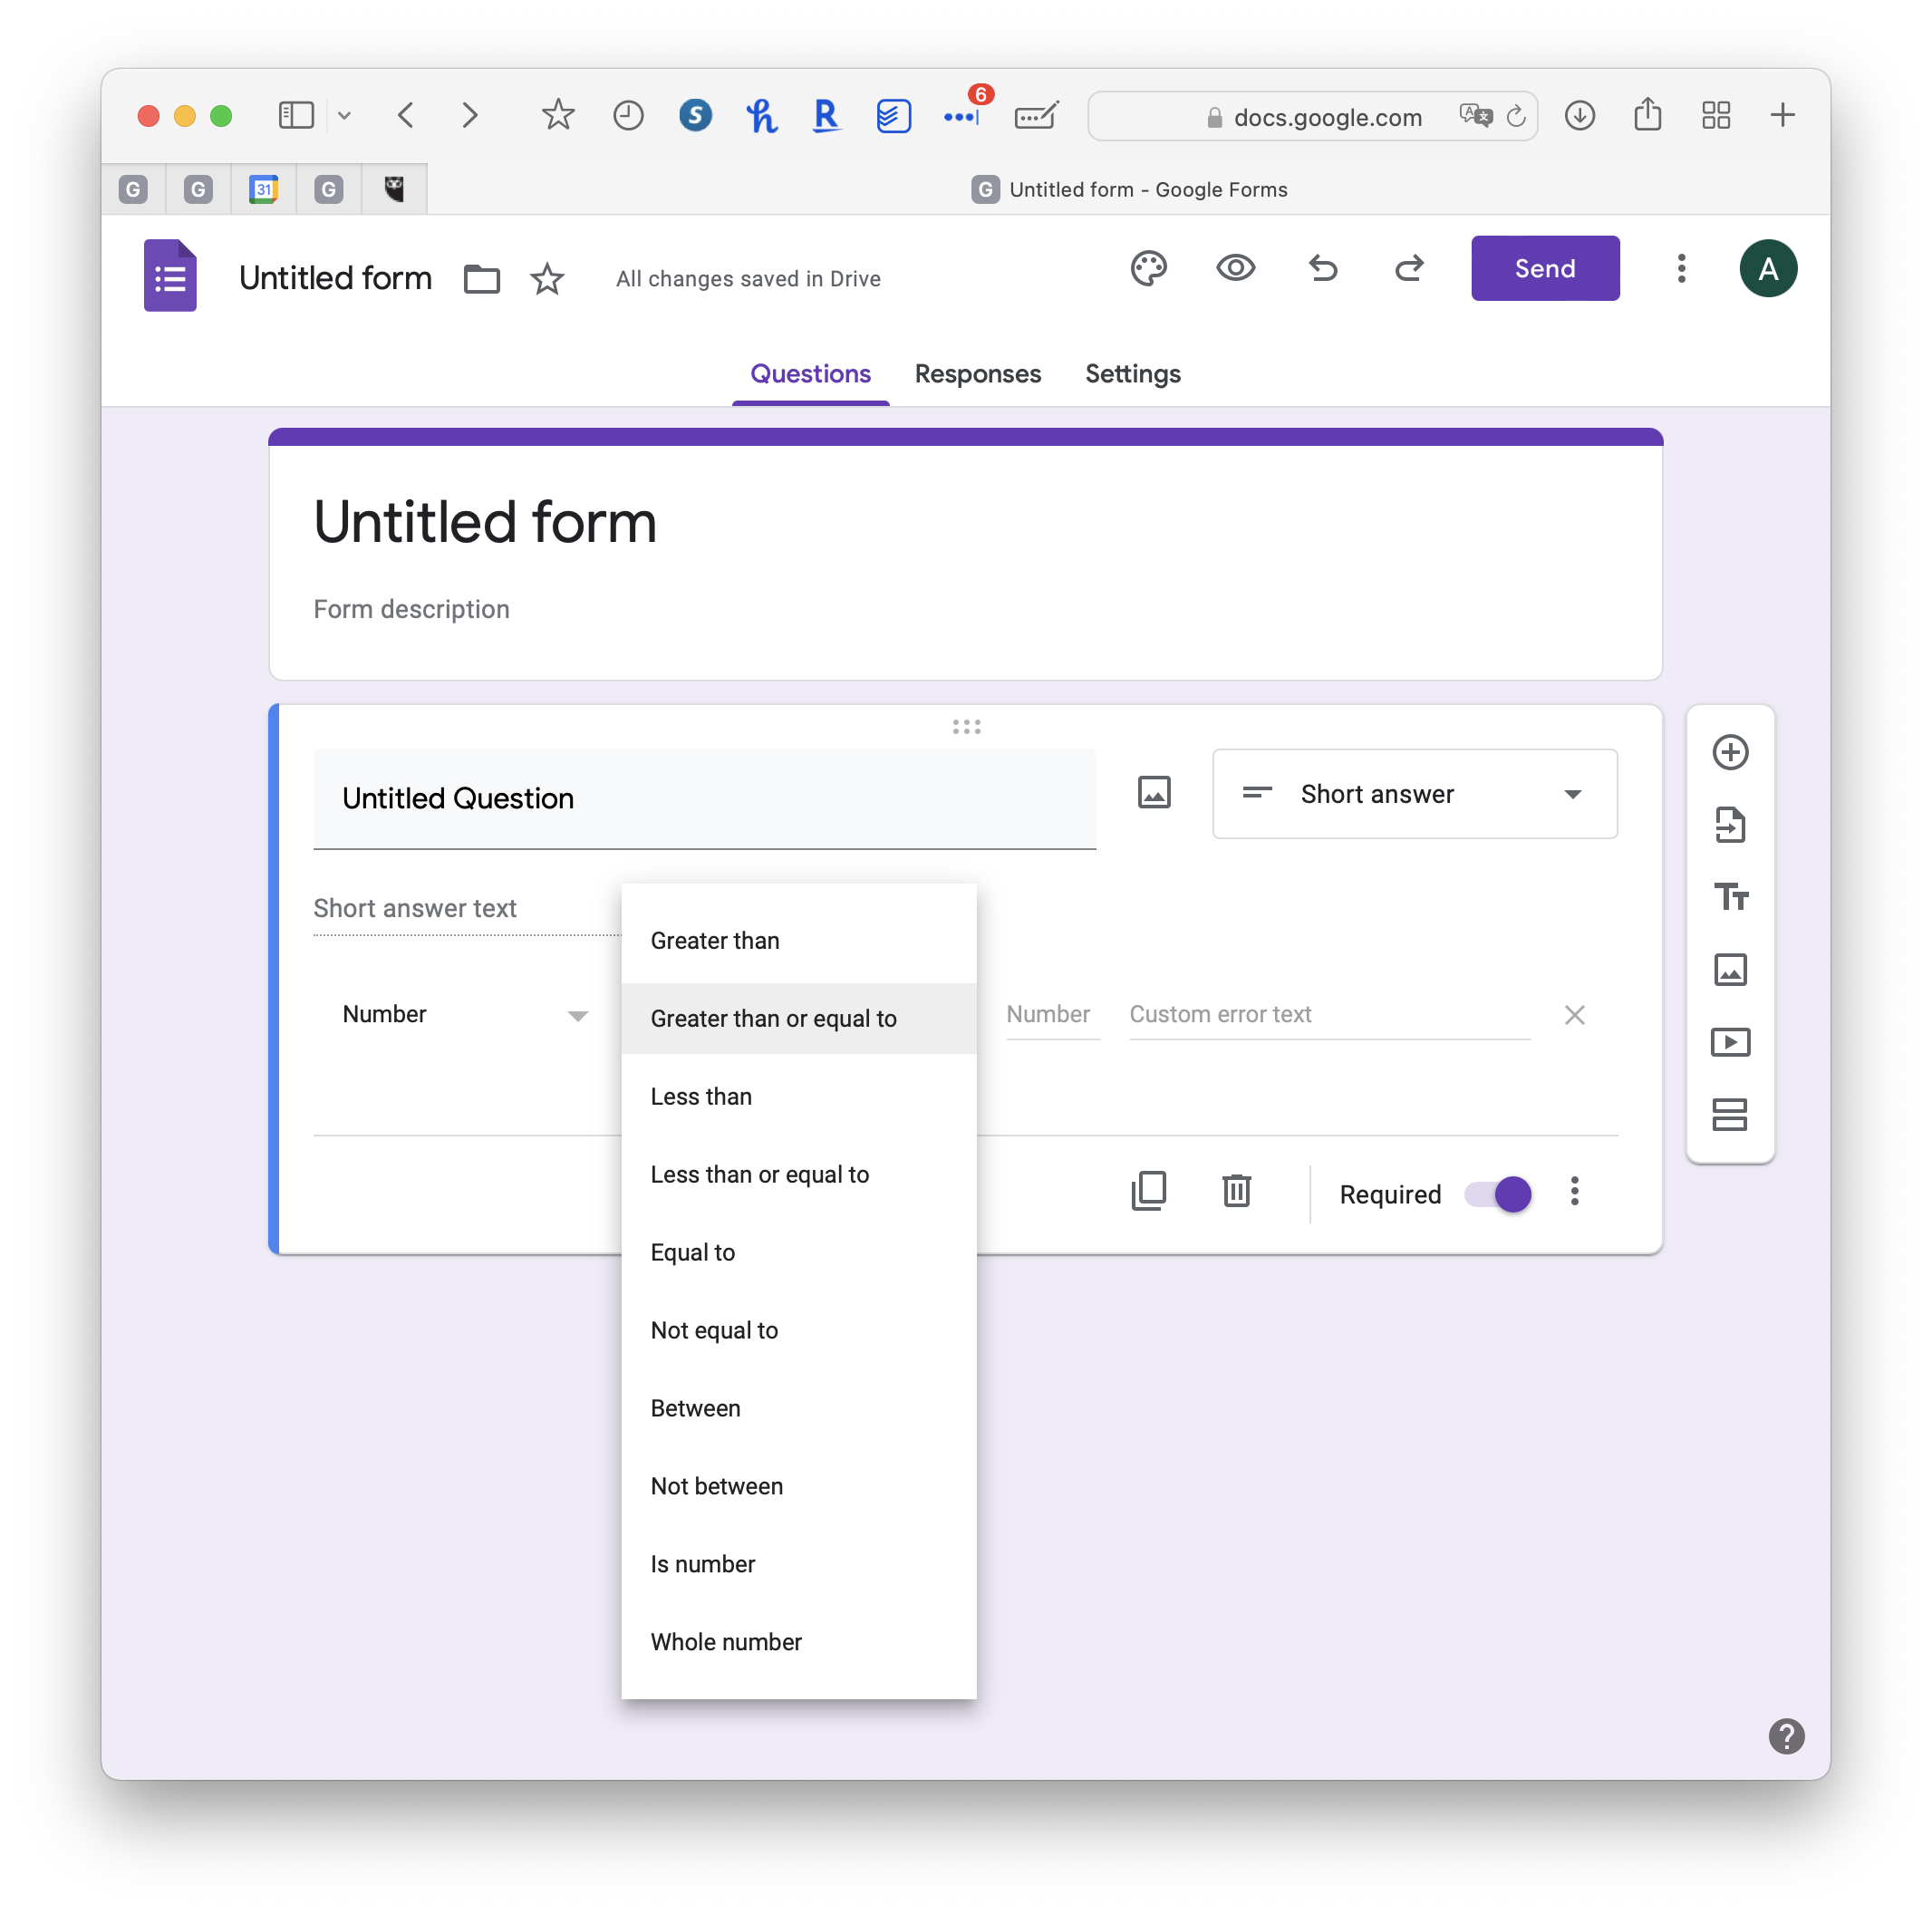
Despite some limitations in comparison with more advanced licensed software, Google Forms does include some elements of data validation. This feature helps ensure responses fall within expected or logical ranges. It is also useful if using google forms as a data collection instrument as opposed to a survey tool, reducing input errors.
Data validation can be applied to short answer responses, paragraph responses and check boxes. For example:
- Short answer: If numeric, you can define limits. For text you can check for a specific word or string type, e.g. URL or email. You can also define the minimum and maximum characters.
- Paragraph: Define the minimum and maximum paragraph length (in characters).
- Checkboxes: Set a minimums for box selection, set maximums, set actual numbers of boxes to be selected.
Both short answer and paragraph responses can also use regular expressions as a form of validation. Regular expressions are formulas that represent a sequence of characters signifying a search pattern. e.g.
^[a-z].*
signifies an input that contains a lowercase letter followed by another character 0 or more times. This might be used within a name field to correct for lack of capitalization of the name.
^: signifies that the string starts with the character(s) or sequence placed after the caret
[a-z]: signifies a search for a character within the given range of characters
.: signifies any character in the given position
*: signifies a search for the preceding character repeated 0 or more times
13.1.4 Building workflows: Options for data integration
13.1.4.1 Qualtrics and qualtRics
qualtRics (note the capital R) is an R package that enables retrieval of Qualtrics data directly from the Qualtrics platform and into R, reducing pre-processing time associated with data manipulation and import. Although Qualtrics is proprietary software, the qualtRics R package is open source and developed within the ROpenSci community.
The package currently contains three core functions:
all_surveys()fetches a list of all surveys that you own or have access to from Qualtrics.fetch_survey()downloads a survey from Qualtrics and loads it into R.read_survey()allows you to read CSV files you download manually from Qualtrics.
Example of the functions in use:
surveys <- all_surveys()
This will create a list of all survey names contained within your Qualtrics account, within the data frame surveys. The survey data have not yet been downloaded. You can download the data from one or more individual surveys of your choice using fetch_survey(). In the example below the researcher is bringing in a subset of data from survey number 4, based on the date of responses.
mysurvey <- fetch_survey(surveys$id[4], start_date = "2018-10-01", end_date = "2018-10-31", label = FALSE)
If you have already downloaded a *.csv filed from Qualtrics, these can be read in from your computer with the read_survey() function. e.g.
mysurvey <- read_survey("/users/aebudden/Desktop/workshop_feedback.csv")
Also contained within the package are the following helper functions:
qualtrics_api_credentials()stores your API key and base url in environment variables.survey_questions()retrieves a data frame containing questions and question IDs for a survey;extract_colmap()retrieves a similar data frame with more detailed mapping from columns to labels.metadata()retrieves metadata about your survey, such as questions, survey flow, number of responses etc.
qualtRics will only enable you to download and integrate survey data that you have administrative access to. Rest assured that someone else cannot use this package to read in your data. However, one limitation is that the package requires Qualtrics API access, which must be enabled in your account to use it. Depending on the type of account you have, this may require administrative approval from your brand ambassador for institutional accounts.
13.1.4.2 Survey Monkey
Similar to Qualtrics and qualtRics, there is an open source R package for working with data in Survey Monkey: Rmonkey. Again, this package requires API access to Survey Monkey and documentation on setup is provided within the Readme file.
Features of RMonkey include the ability to:
createsurvey()which will create an email collector survey from a template of another survey examplecreatecollector()which will create a web collector survey from a template of another survey examplegetresponses()will return responses from a survey- List various entities including
surveylist()templatelist()respondentlist()
Also like qualtRics this package is open source and community developed. Inspection of the GitHub repository shows that the last updates were made 5 years ago and so the package may not function as intended.
There are also commercial options available. For example, cdata have a driver and R package that enable access to an analysis of Survey Monkey data through R.
13.1.5 Google forms
Google forms can be a great way to set up surveys, and it is very easy to interact with the results using R. The benefits of using google forms are a simple interface and easy sharing between collaborators, especially when writing the survey instrument.
The downside is that google forms has far fewer features than Qualtrics in terms of survey flow and appearance.
To show how we can link R into our survey workflows, I’ve set up a simple example survey here.
I’ve set up the results so that they are in a new spreadsheet here:. To access them, we will use the googlesheets4 package.
First, open up a new R script and load the googlesheets4 library:
library(googlesheets4)Next, we can read the sheet in using the same URL that you would use to share the sheet with someone else. Right now, this sheet is public
responses <- read_sheet("https://docs.google.com/spreadsheets/d/1CSG__ejXQNZdwXc1QK8dKouxphP520bjUOnZ5SzOVP8/edit?usp=sharing")## ✓ Reading from "Example Survey Form (Responses)".## ✓ Range 'Form Responses 1'.The first time you run this, you should get a popup window in your web browser asking you to confirm that you want to provide access to your google sheets via the tidyverse (googlesheets) package.
My dialog box looked like this:
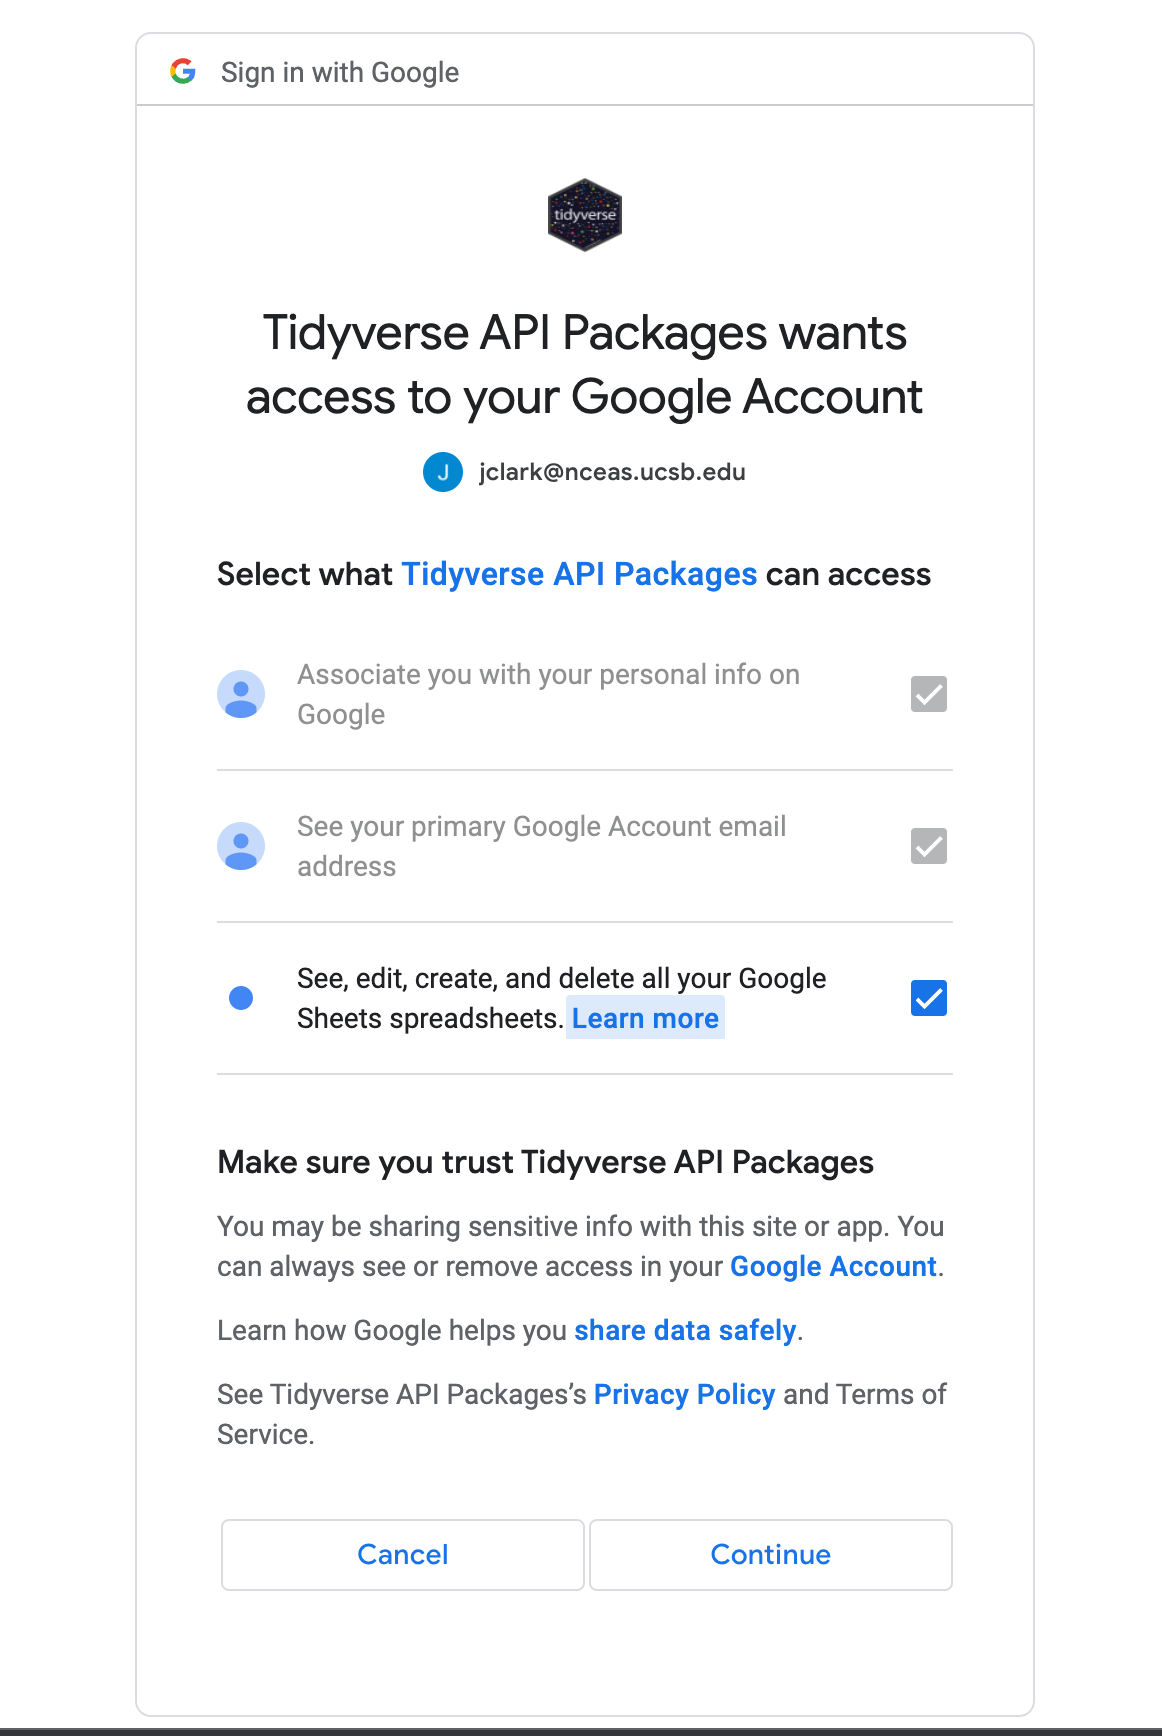
Make sure you click the third check box enabling the Tidyverse API to see, edit, create, and delete your sheets. Note that you will have to tell it to do any of these actions via the R code you write.
When you come back to your R environment, you should have a data frame containing the data in your sheet!
Bypassing authentication for public sheets
If you don’t want to go through a little interactive dialog every time you read in a sheet, and your sheet is public, you can run the function gs4_deauth() to access the sheet as a public user. This is helpful for cases when you want to run your code non-interactively. This is actually how I set it up for this book to build!