7 Group Project: Staging and Preprocessing
7.1 Learning Objectives
- Get familiarized with the overall group project workflow
- Write a
parslapp that will stage and tile the IWP example data in parallel
7.2 Introduction
The Permafrost Discovery Gateway is an online platform for archiving, processing, analysis, and visualization of permafrost big imagery products to enable discovery and knowledge-generation. The PDG utilizes and makes available products derived from high resolution satellite imagery from the Polar Geospatial Center, Planet (3 meter resolution), Sentinel (10 meter resolution), Landsat (30 meter resolution), and MODIS (250 meter resolution). One of these products is a dataset showing Ice Wedge Polygons (IWP) that form in melting permafrost. Explore the Imagery Viewer, where you can visualize different data layers submitted by Arctic researchers.
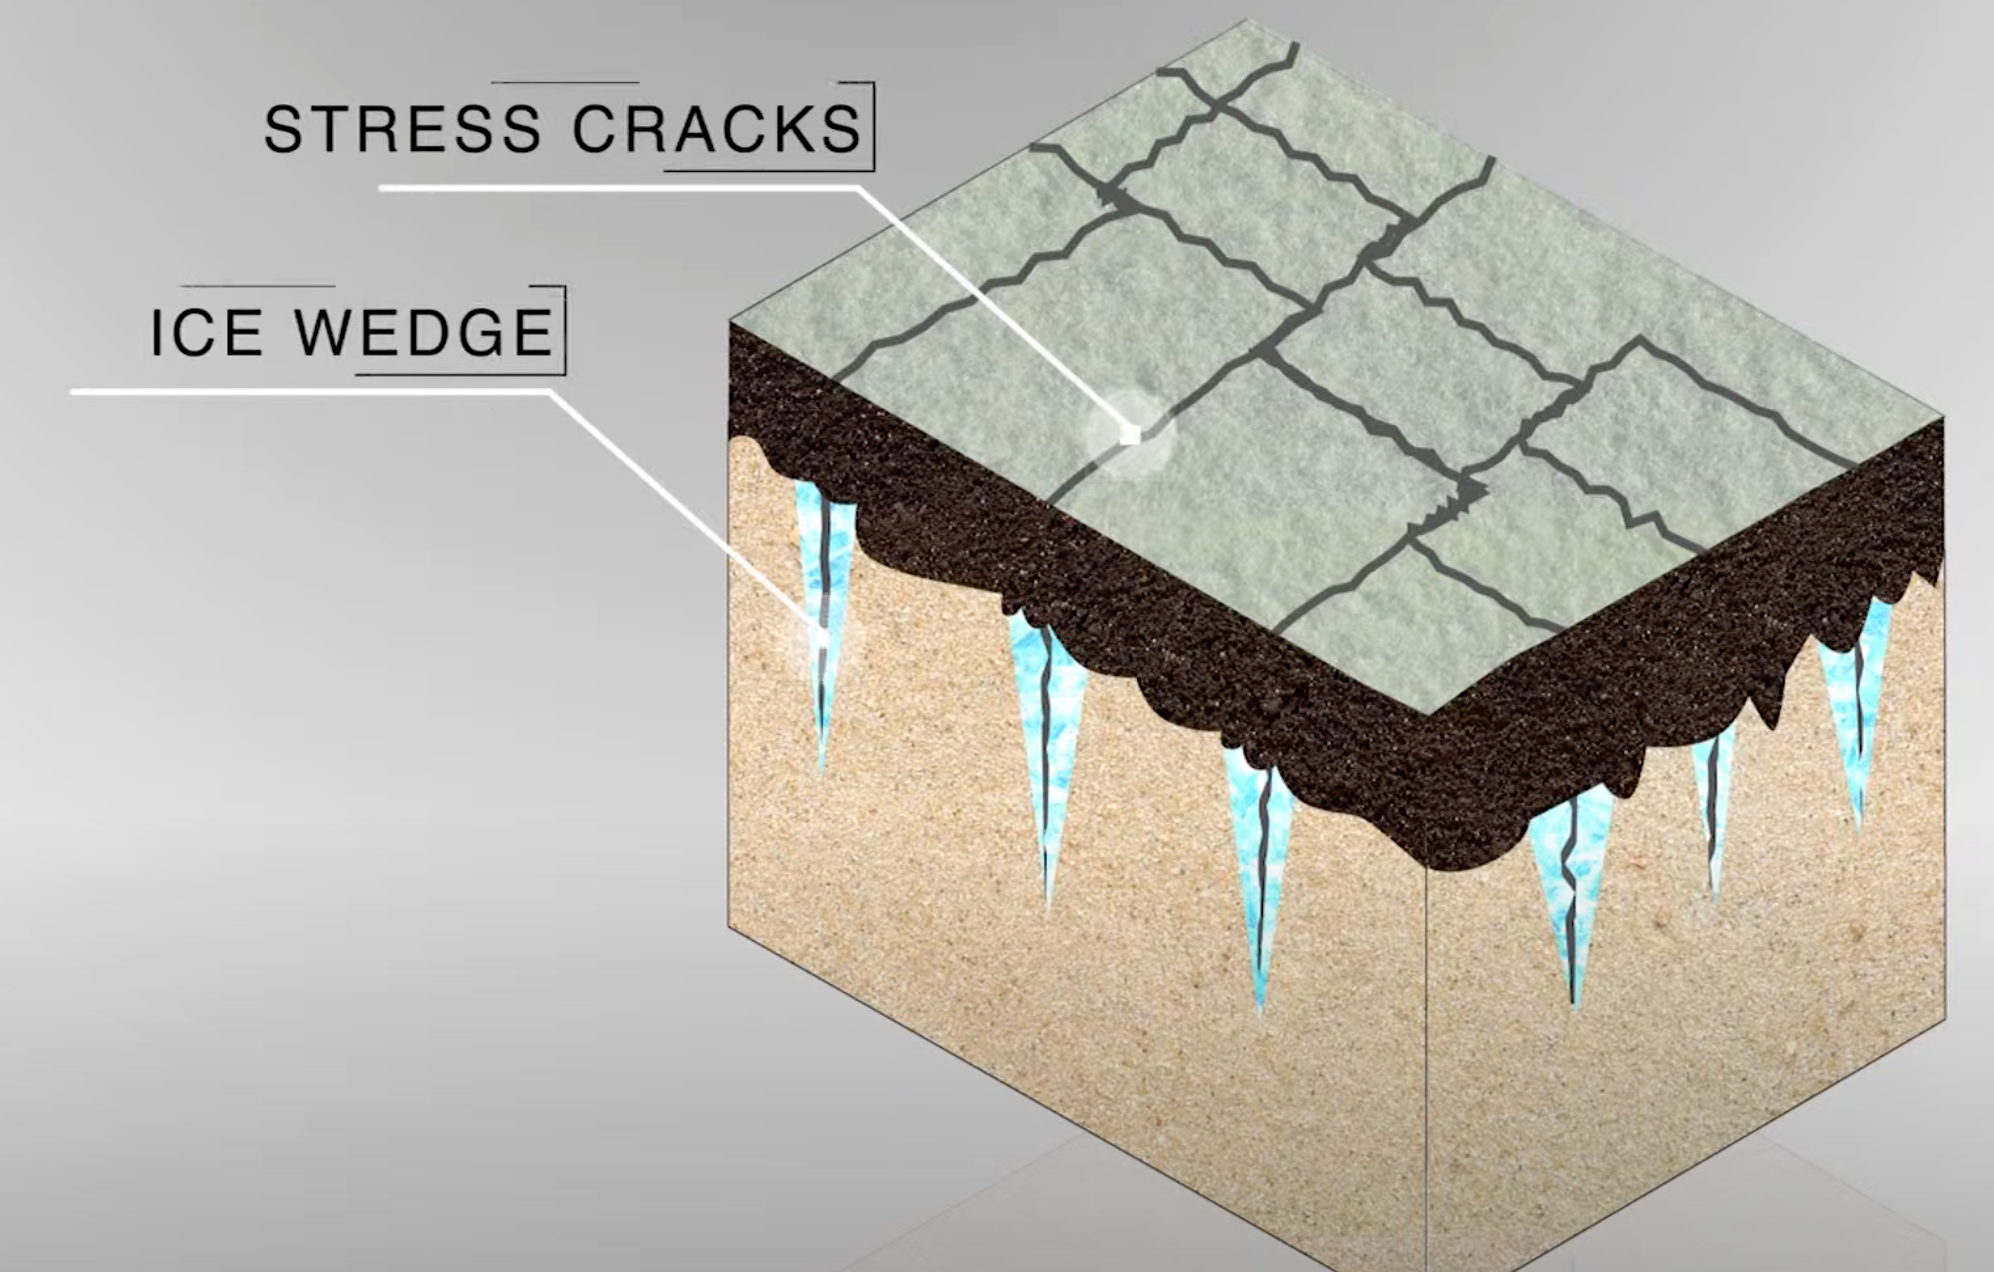
Ice wedges form as a result of long-term melting and freezing cycles of permafrost. Very cold winters cause the frozen ground to crack, and these cracks fill with melted snow in the spring. The water in the cracks freezes and expands, and this repeats over thousands of years, until the ice wedges are several meters thick. Ice wedges can form very distinctive enclosed geometries that are clearly visible in high-resolution satellite images. Long-term gradual warming of the soil combined with extreme summer warmth causes the ice wedges to melt from the top, and eventually the ground subsides.
Identifying where these ice wedge features exist is important to understanding how the Arctic landscape is changing. Time series analysis will help researchers, community members, and policy-makers address threats to the biota, architecture, and communities throughout the region. To learn more about how this data was produced, see this publication.
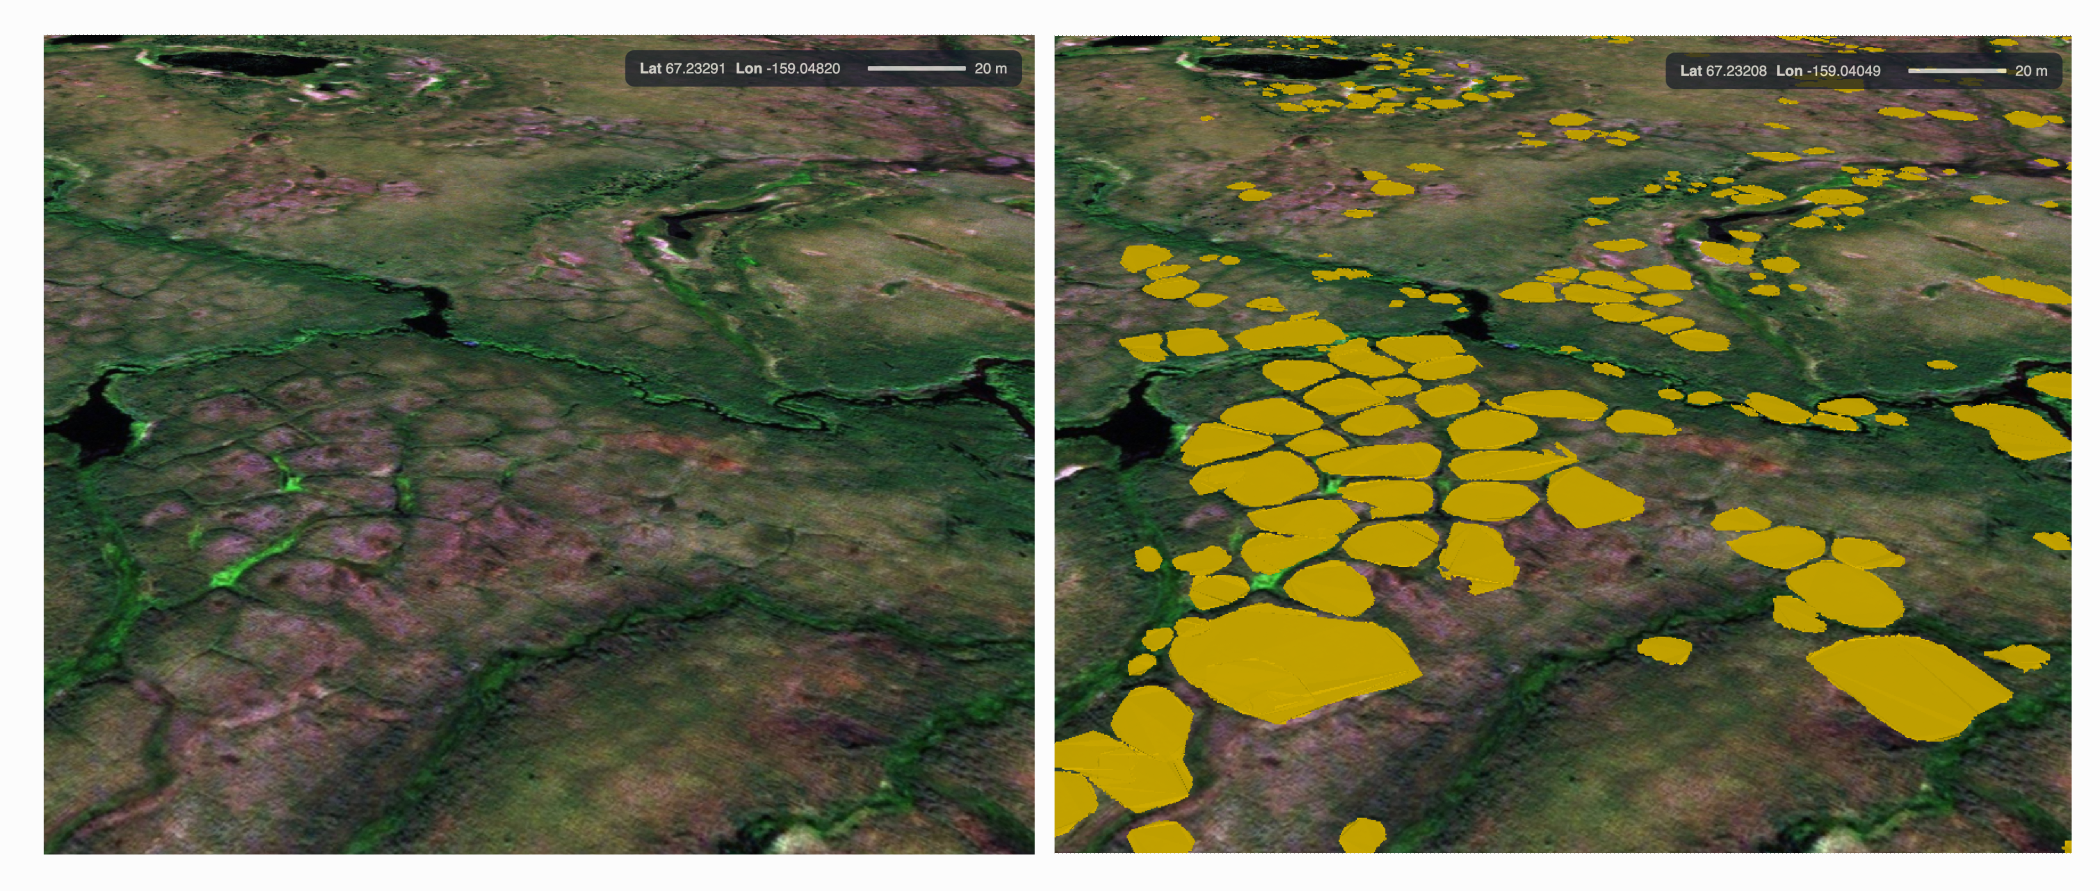
The PDG team is using advanced analysis and computational tools to process high-resolution satellite imagery and automatically dectect where ice wedge polygons form. Below is an example of a satellite image (left) and the detected ice wedge polygons in geospatial vector format (right) of that same image.
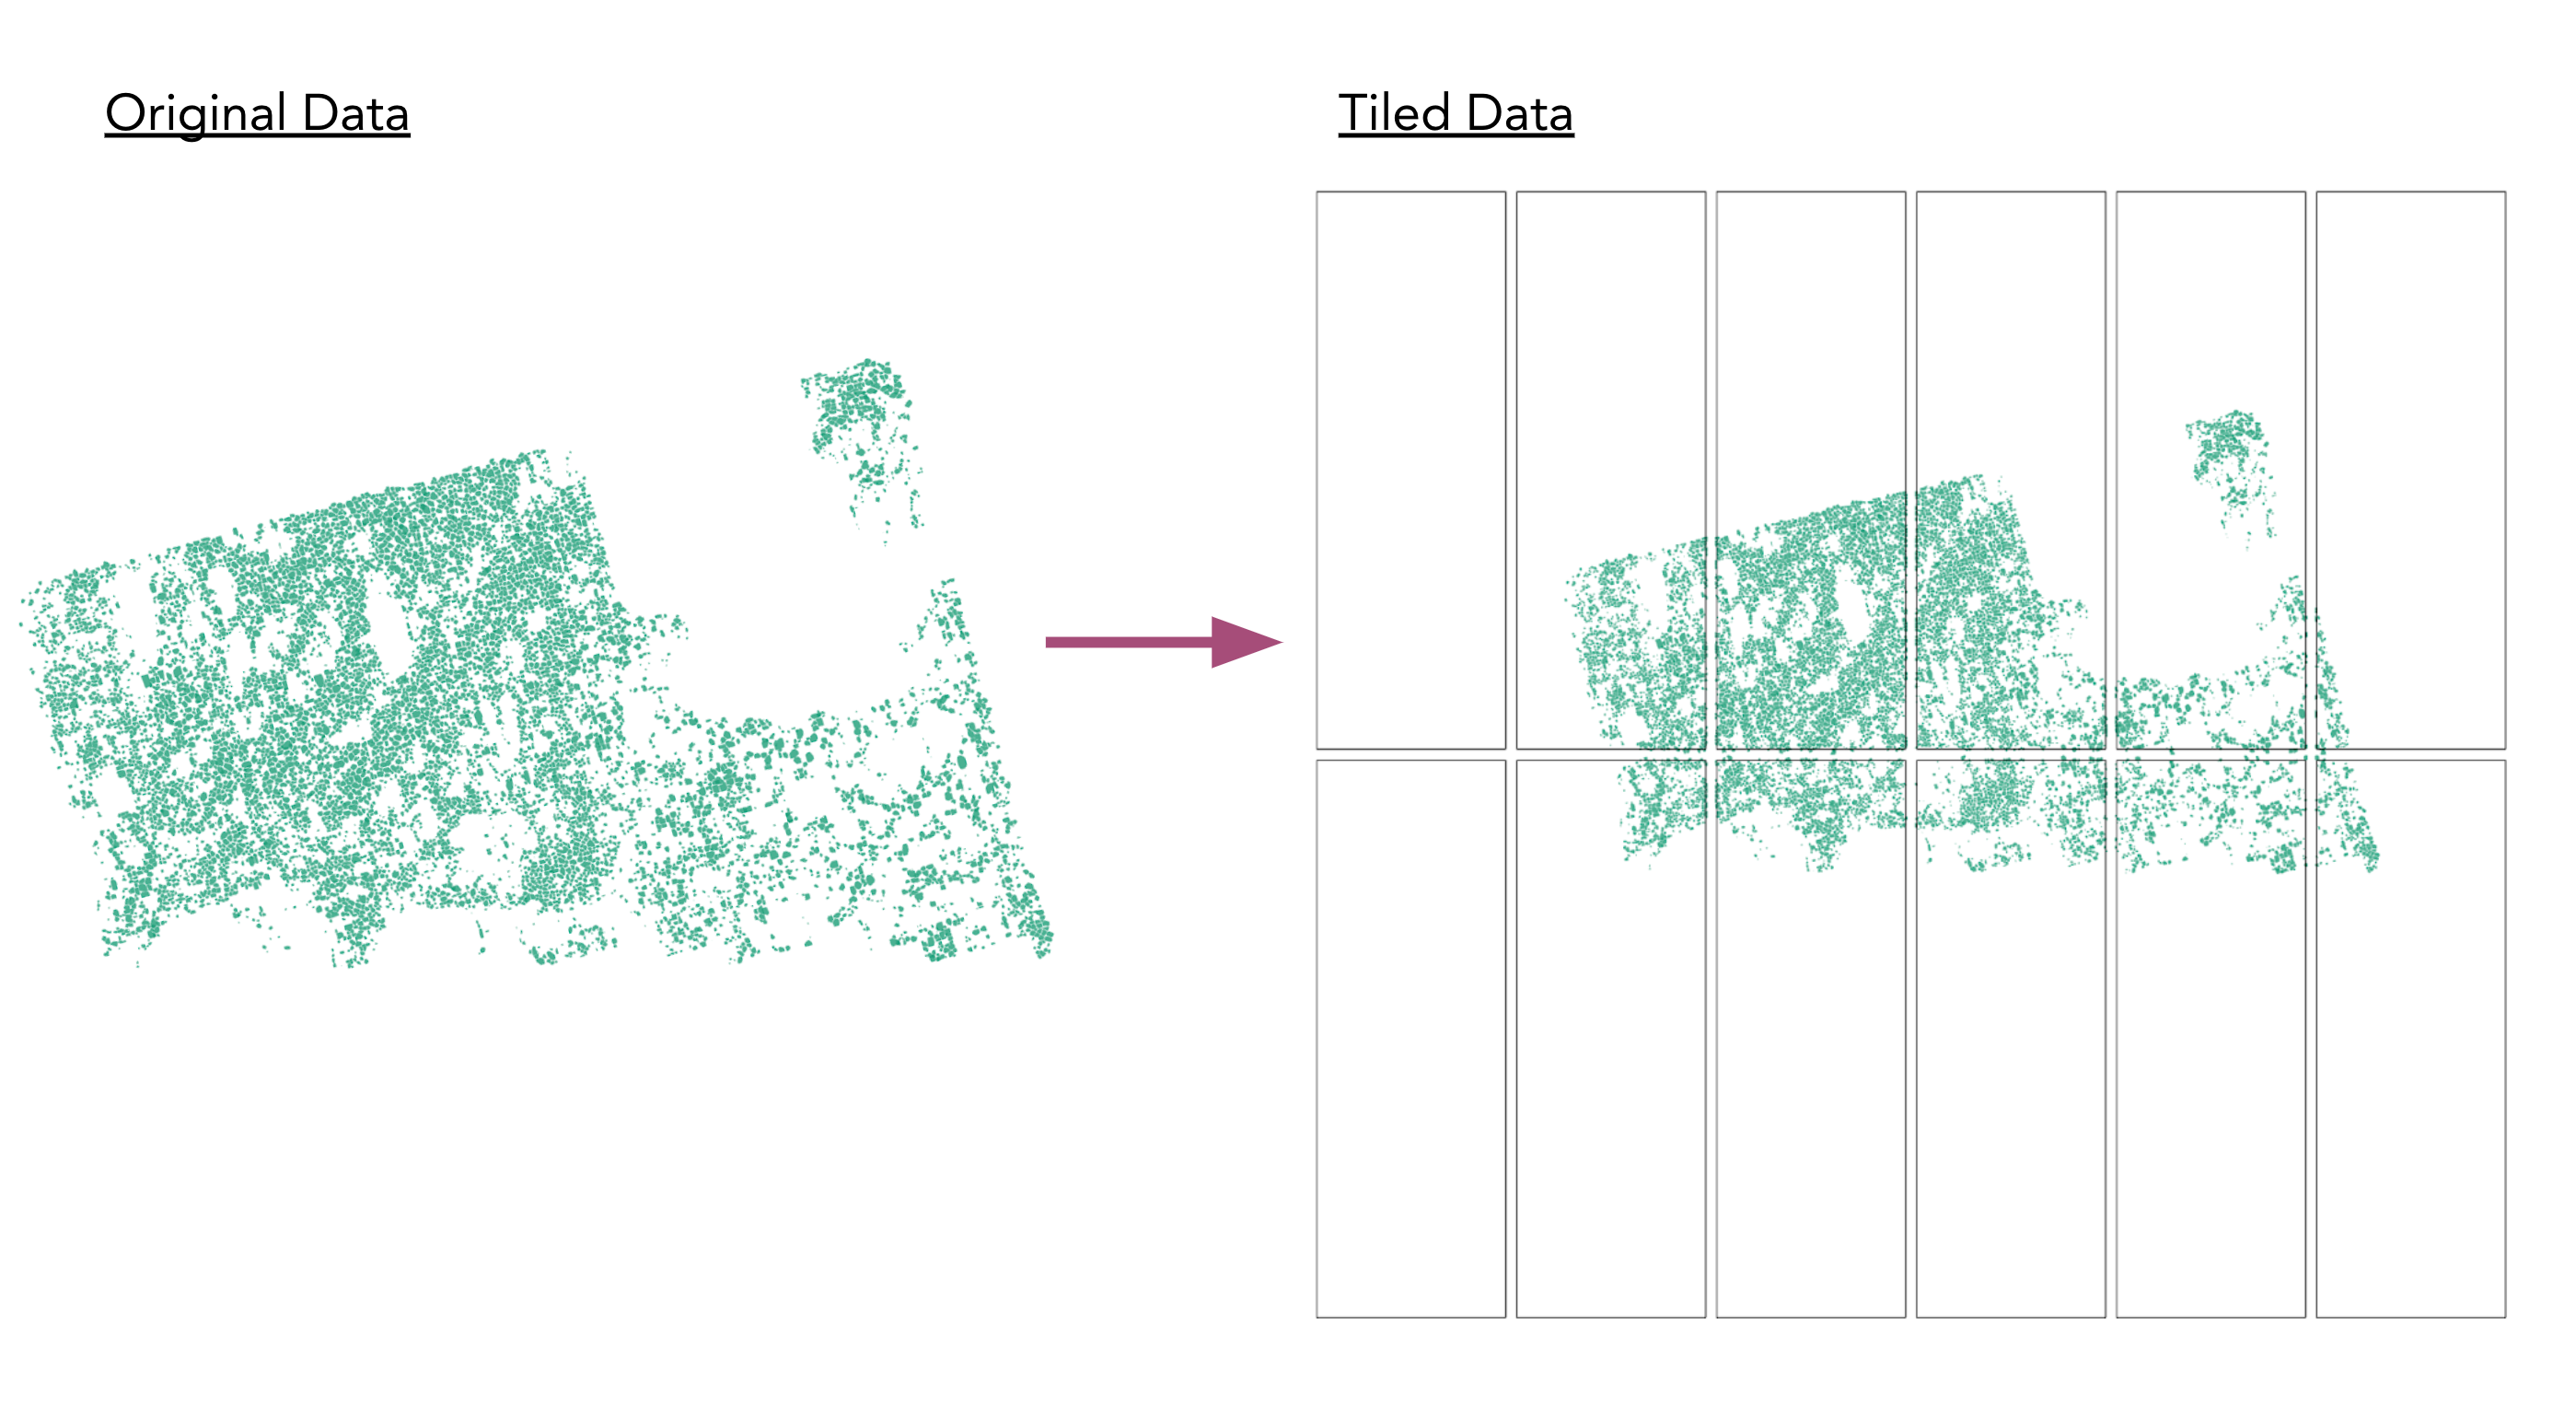
In the group project, we are going to use a subset of the high-resolution dataset of these detected ice wedge polygons in order to learn some of the reproducible, scalable techniques that will allow us to process it. Our workflow will start with a set of GeoPackage files that contain the detected ice wedge polygons. These files all have irregular and sometimes overlapping extents due to the variation in satellite coverage, clouds, etc. Our first processing step will take these files and “tile” them into smaller files which have regular extents.
In step two of the workflow, we will take those regularly tiled GeoPackage files and rasterize them. The files will be regularly gridded, and a summary statistic will be calculated for each grid cell (such as the proportion of pixel area covered by polygons).
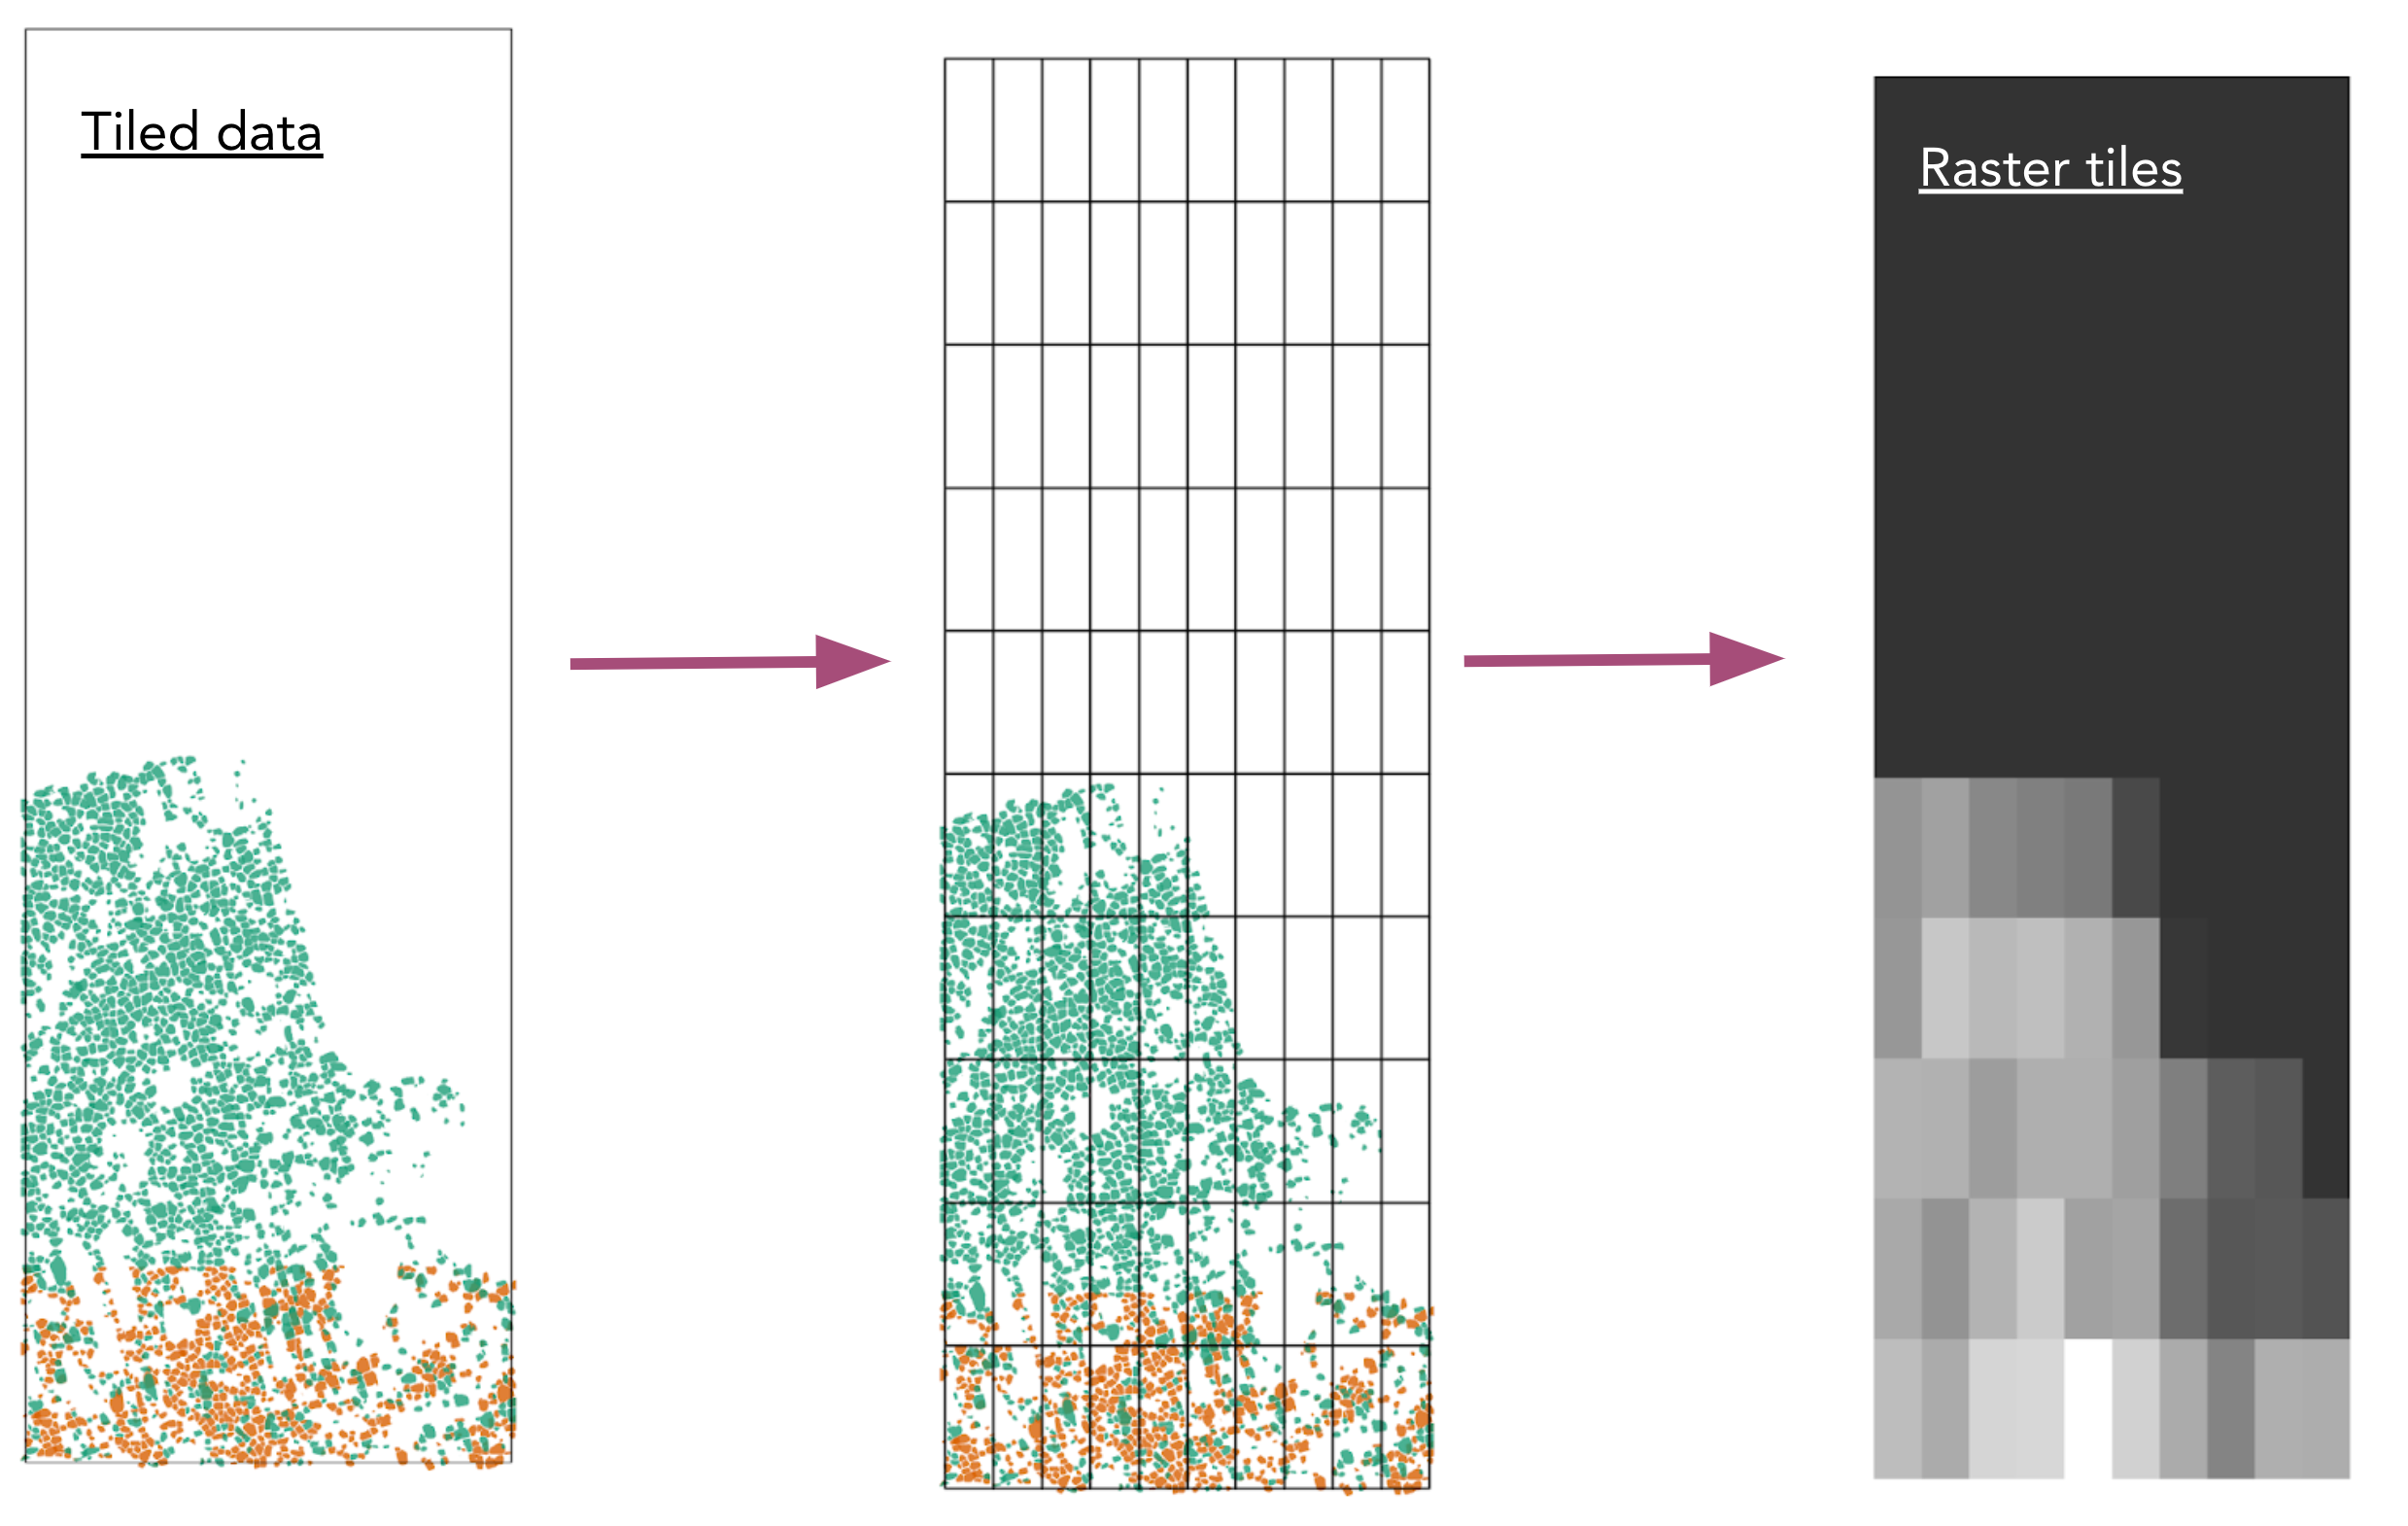
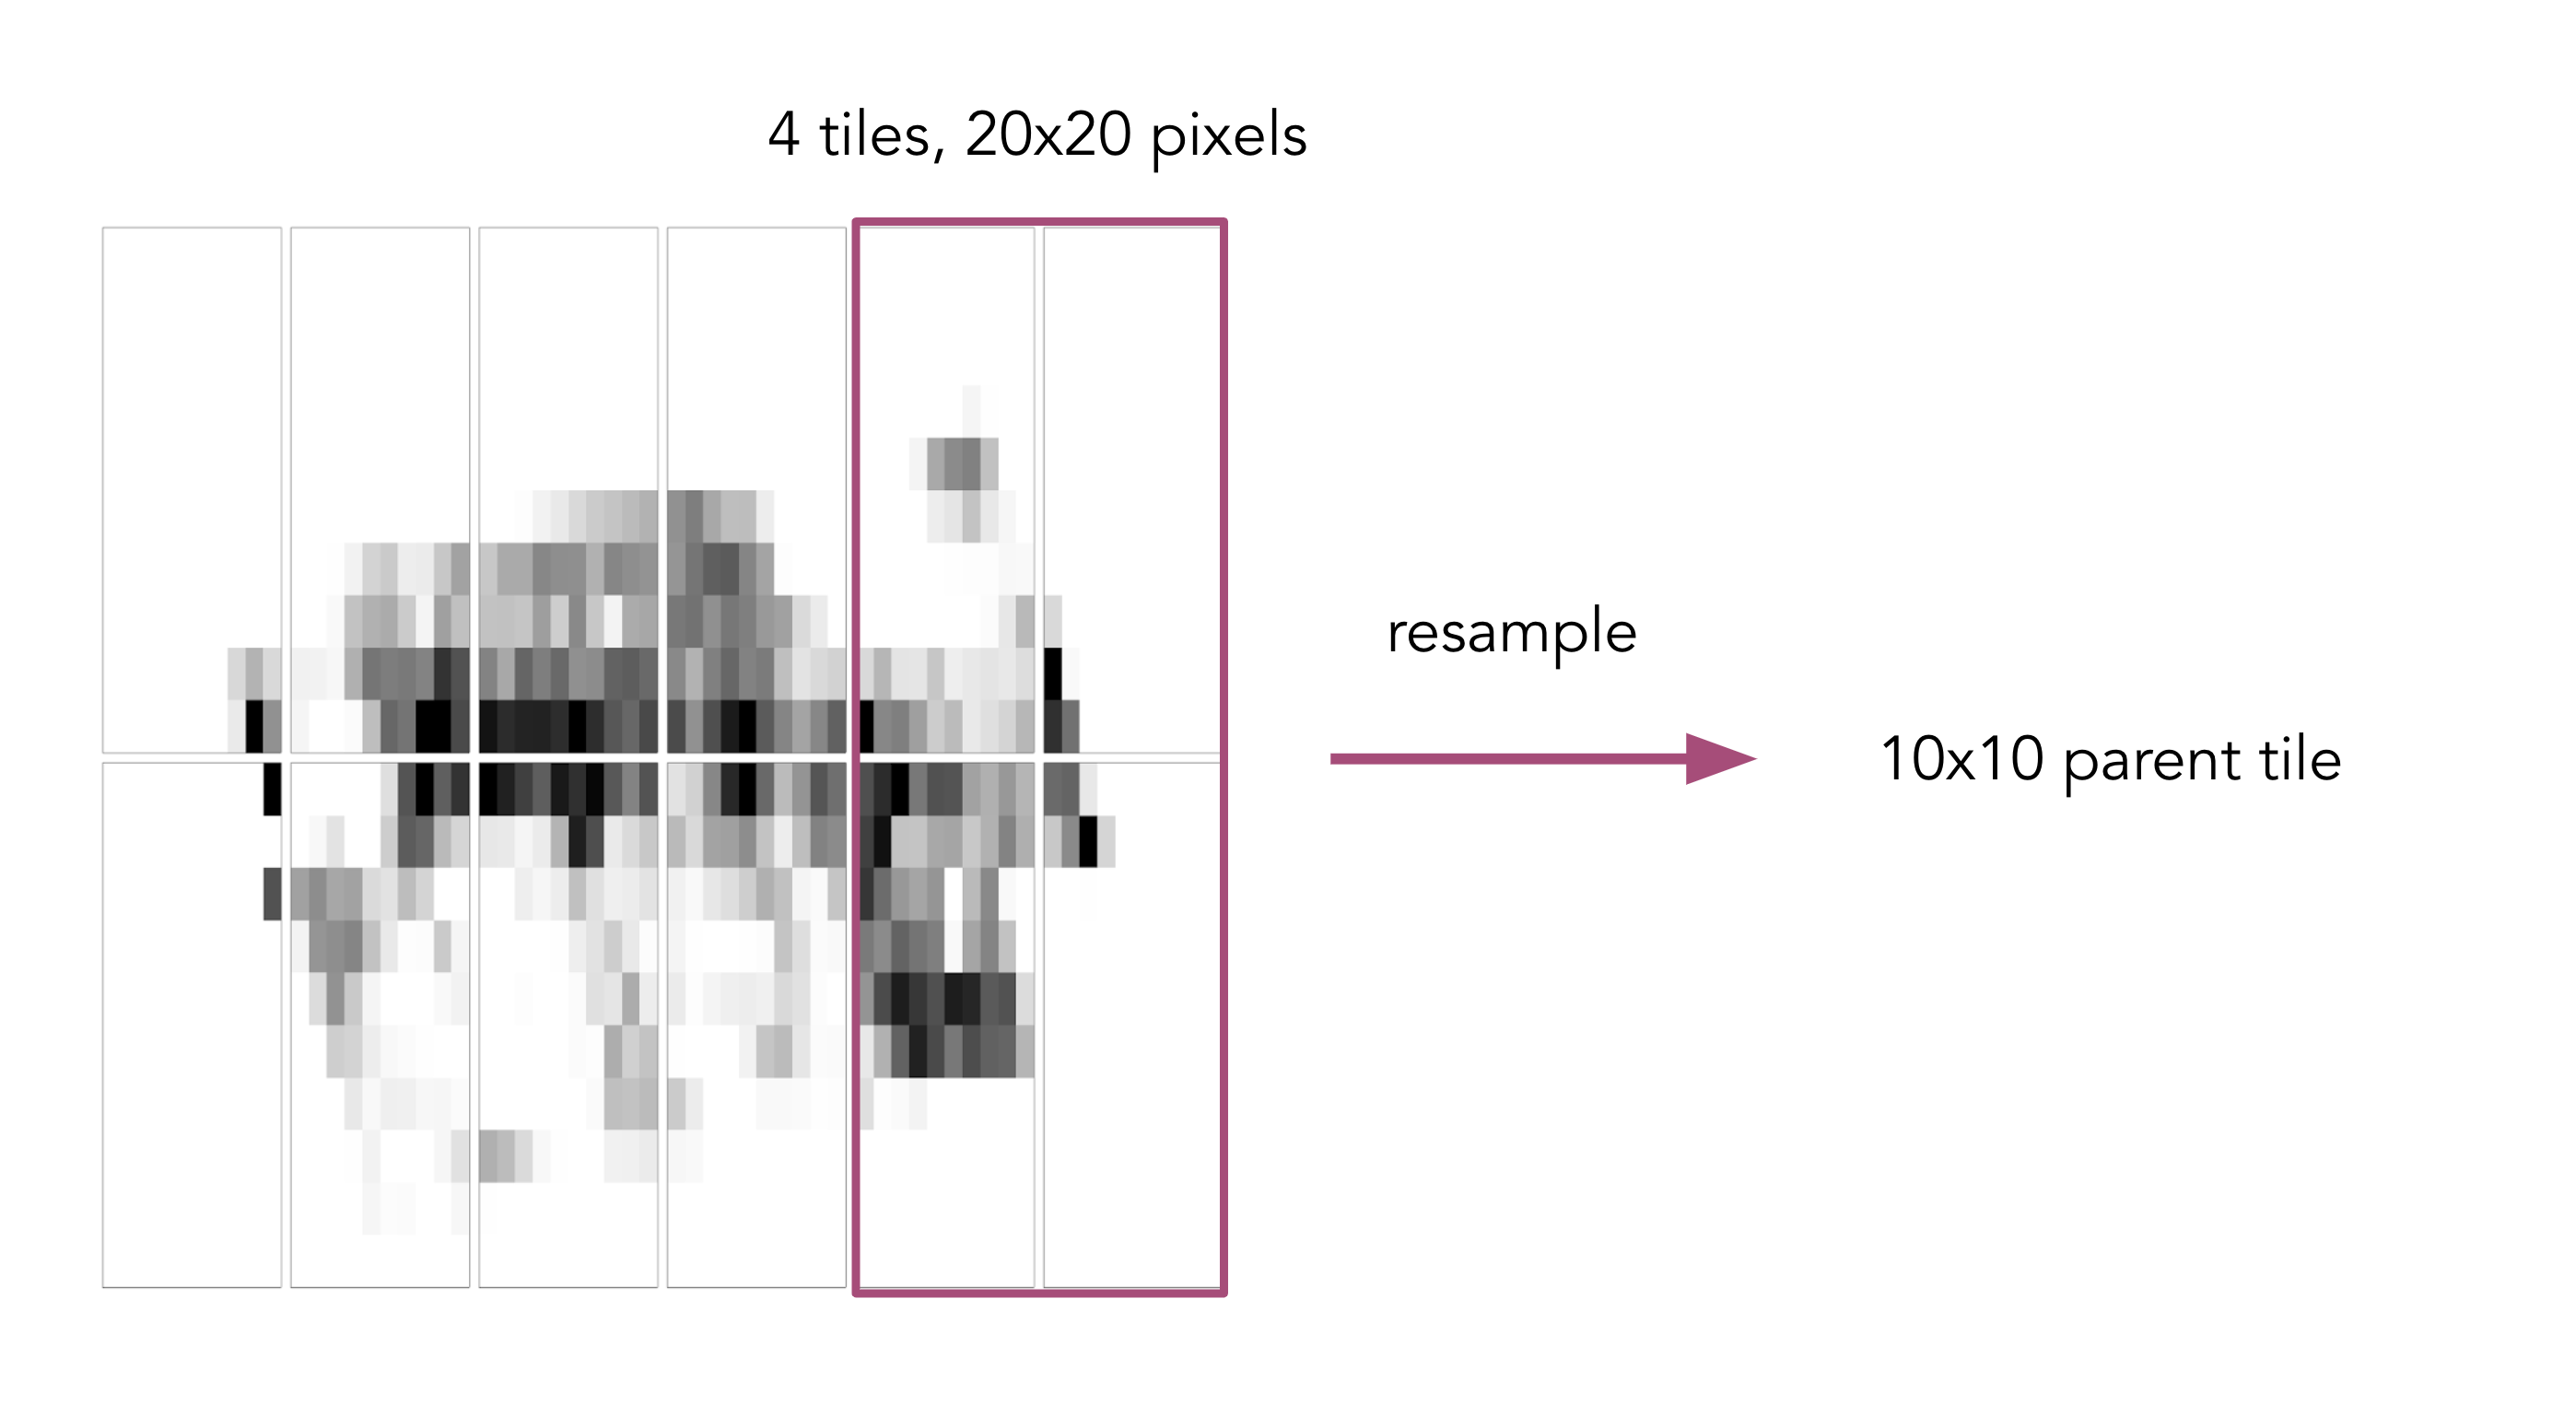
In the final step of the workflow, we will take the raster files and resample them to create a set of raster tiles at different resolutions. This last step is what will enable us to visualize our raster data dynamically, such that we see the lower resolution rasters when very zoomed out (and high resolution data would take too long to load), and higher resolution data when zoomed in and the extent is smaller. Then we convert each of these .tif files into PNG files that we can visualize on a basemap.
7.3 Staging and Tiling
Today we will undertake the first step of the workflow, staging and tiling the data.
In your fork of the scalable-computing-examples repository, open the Jupyter notebook in the group-project directory called session-07.ipynb. This workbook will serve as a skeleton for you to work in. It will load in all the libraries you need, including a few helper functions we wrote for the course, show an example for how to use the method on one file, and then lays out blocks for you and your group to fill in with code that will run that method in parallel.
In your small groups, work together to write the solution, but everyone should aim to have a working solution on their own fork of the repository. In other words, everyone should type out the solution themselves as part of the group effort. Writing the code out yourself (even if others are contributing to the content) is a great way to get “mileage” as you develop these skills.
Only one person in the group should run the parallel code.
7.3.1 Packages, Libraries, and Modules
- os 3.11.2
- parsl 2023.3.20
- pdgstaging
- package developed by Permafrost Discovery Gateway software developer and designer Robyn Thiessen-Bock
- geopandas0.11
- random
- matplotlib 3.5